Resolved HII Regions with SIGNALS

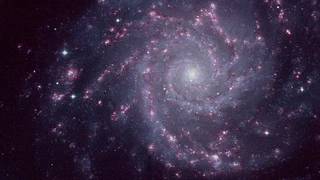 The Phantom Galaxy, NGC 628, as seen through SITELLE.
Nebular emission lines are some of our most powerful tools for studying galaxies. From a handful of bright lines, we routinely estimate properties of star-forming regions (and whole galaxies) such as chemical abundances, ionization parameters, densities, temperatures, dust extinctions, and the source of ionizing radiation. But every one of those estimations depends on assumptions.
We often assume a geometry for the ionized gas, a relationship between the gas and its ionizing stars, a chemical abundance pattern, or that a spectrum integrated over an H II region adequately represents everything inside it. Those assumptions become especially important when the same diagnostics are applied to galaxies too distant to resolve.
My work with the Star-formation, Ionized Gas, and Nebular Abundances Legacy Survey (SIGNALS) attempts to answer the question: What physical information do these lines provide, and when do our assumptions about these diagnostics break down?
SIGNALS uses an instrument called SITELLE, a wide-field imaging Fourier transform spectrometer at the Canada-France-Hawaii Telescope (CFHT) to obtain spatially resolved spectroscopy across nearby galaxies. In my mind, SITELLE is the halfway point between narrowband photometry and true integral-field spectroscopy. We take images in particular wavelength ranges (usually targeting bright emission lines), but inside each of those images, we have spectral information. SITELLE’s combination of a large field of view and its high spatial resolution makes it possible to study multiple things at once: individual H II regions, populations of H II regions across a galaxy, and the larger galactic environments in which those regions form.
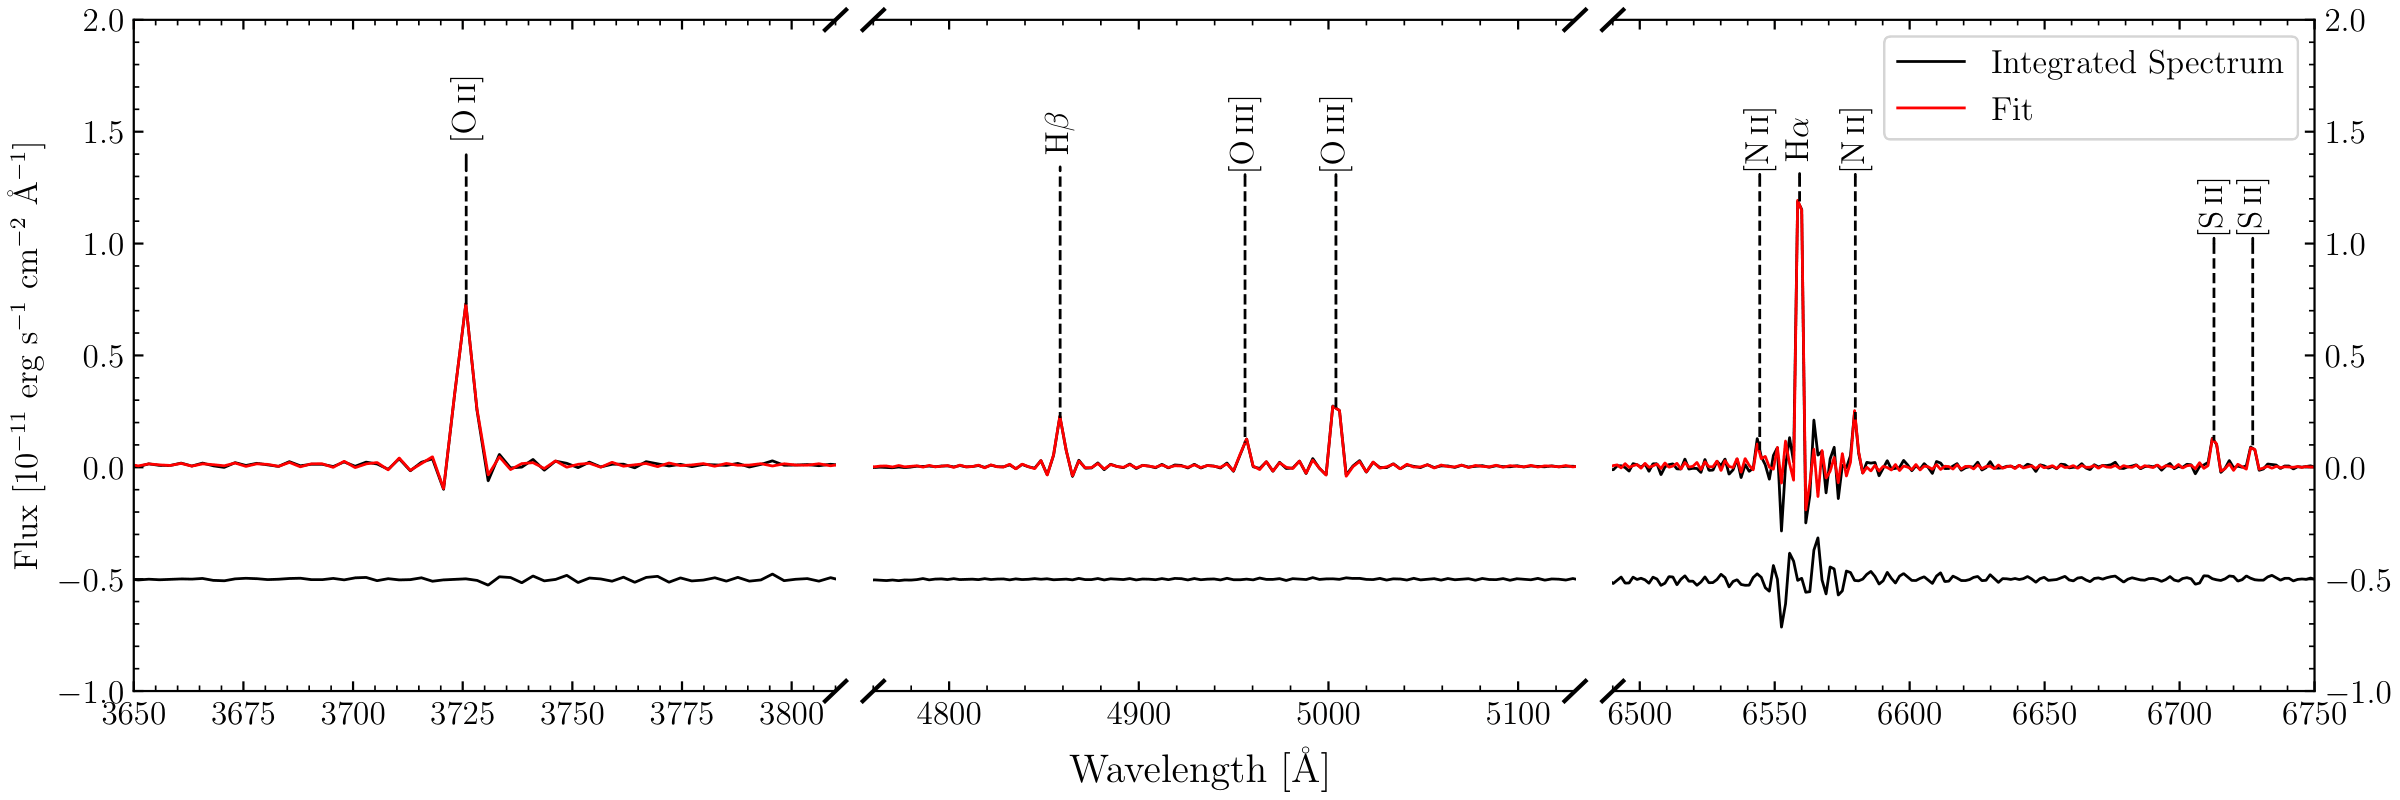
An example of a SITELLE spectrum. SITELLE collects data in three filters, targeting the strong optical emission lines. Because it is an imaging Fourier transform spectrometer, SITELLE spectra have a characteristic shape described by a sincgauss function rather than a standard Gaussian. Figure 2 in Garner et al. (2026).
My involvement in SIGNALS has likewise spanned several scales. I have led projects on H II region diagnostics and giant H II region structure, contributed methods and analyses to studies as a co-author, obtained new SITELLE observations to pursue my own questions, and participated in the broader scientific organization of the collaboration.
Testing the Assumptions Behind Nebular Diagnostics
Metallicity and ionization parameter are two of the most important quantities used to describe an H II region. Both strongly affect its emission-line spectrum, and they are often thought to be anti-correlated: as the oxygen abundance increases, the ionization parameter decreases. Yet, numerous investigations have found either no correlation or a positive correlation, sparking renewed interest in how these properties are related. As if to make things worse, published calibrations of the ionization parameter can disagree substantially because they are derived from photoionization models containing different assumptions about stellar populations, chemical abundances, dust, density, and nebular geometry.
Rather than adopting one of these calibrations, I constructed a custom grid of Cloudy photoionization models and used NebulaBayes to infer oxygen abundance and ionization parameter simultaneously for more than 1,500 H II regions across the nearby face-on spiral galaxy NGC 628.
I recovered the expected anti-correlation between oxygen abundance and ionization parameter, but the more important result was how strongly the inferred relationship depended on the assumptions built into the models. The correlation also showed substantial intrinsic scatter, with dust extinction emerging as one secondary variable related to both quantities.
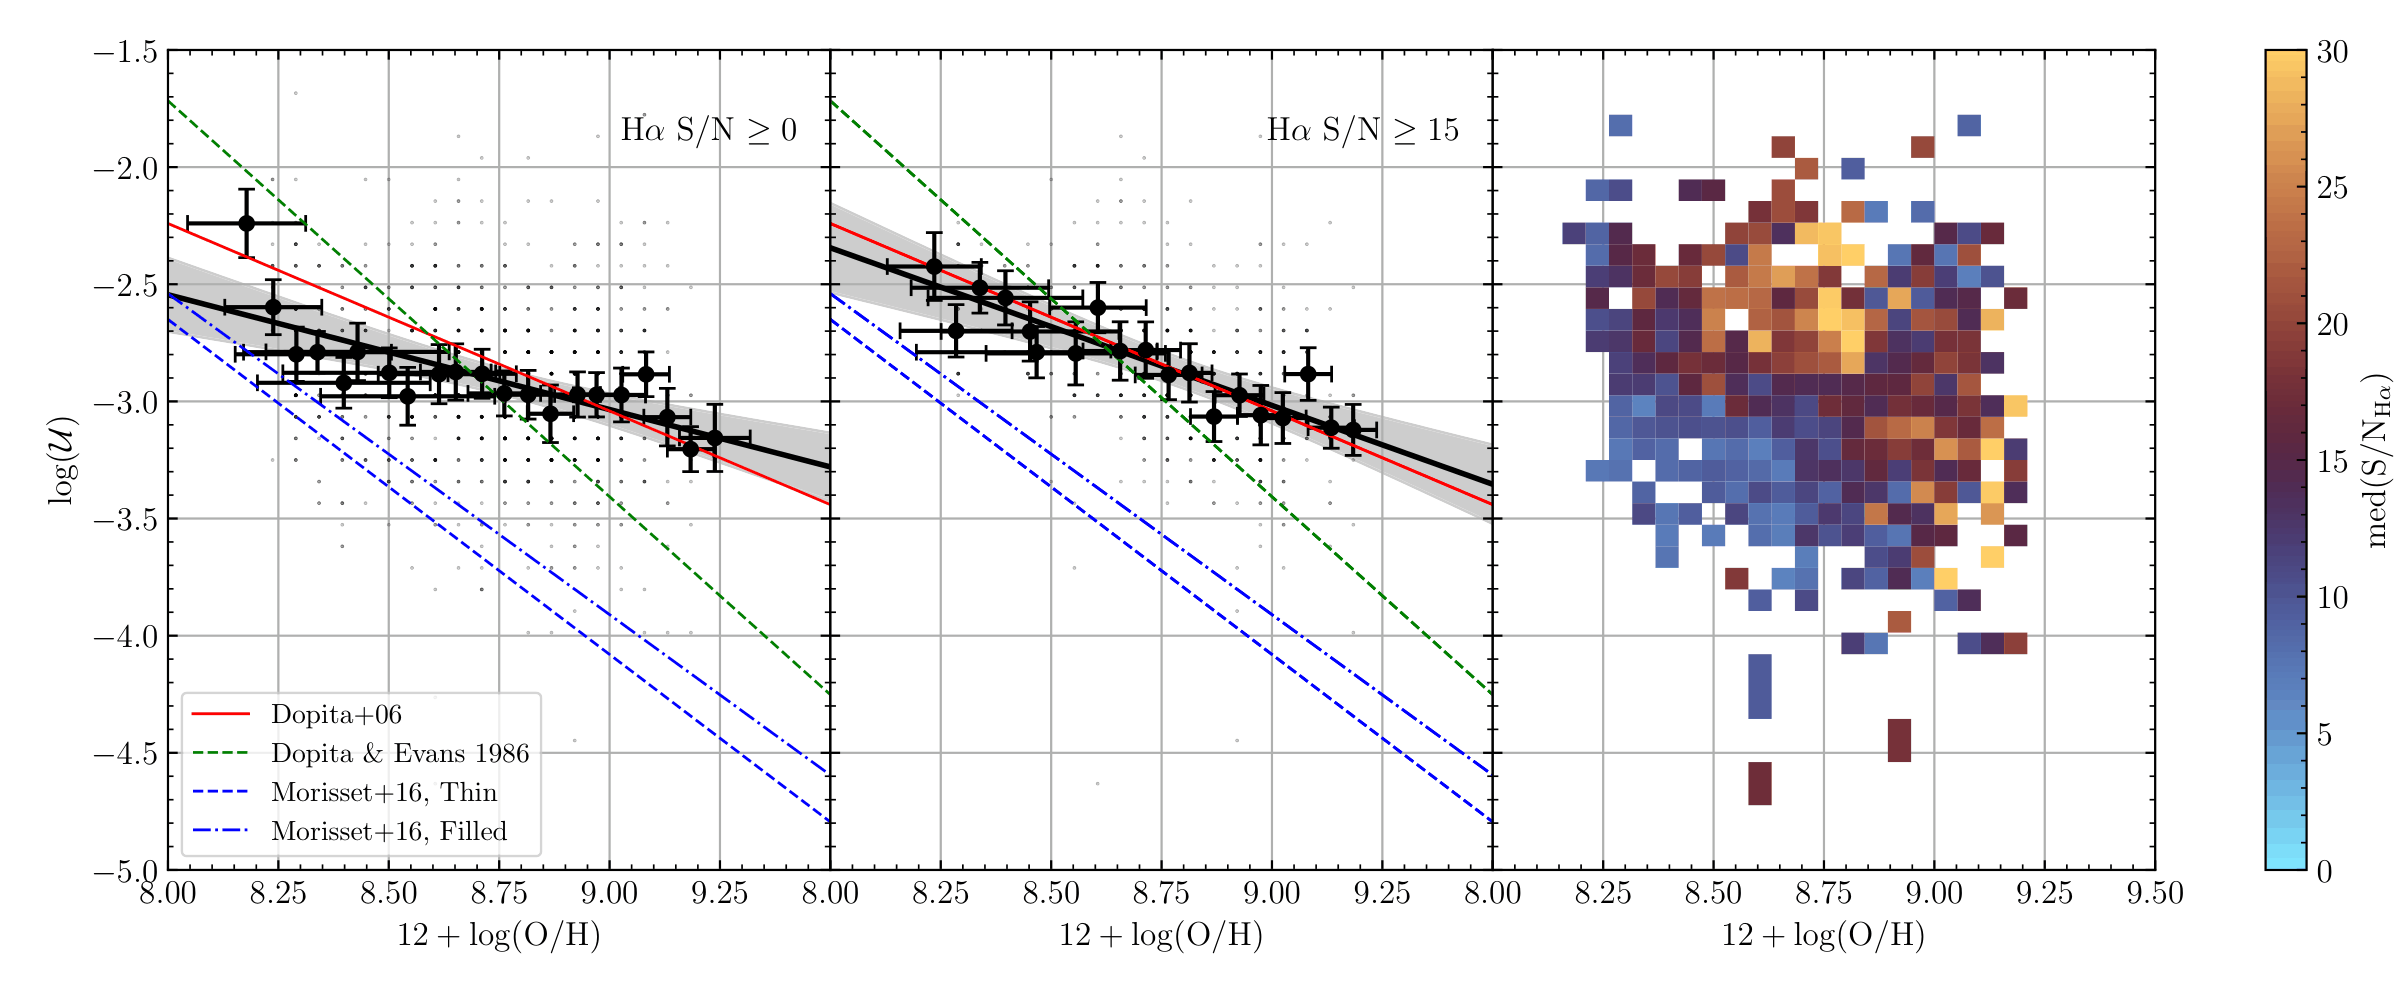
The ionization parameter (log U) - oxygen abundance (12 + log(O/H)) relation. The left panel shows all H II regions regardless of signal-to-noise. The middle panel selects only those with a signal-to-noise of at least 15. The right panel shows how the signal-to-noise varies across the plot. The small points are the raw data analyzed through NebulaBayes, which are binned into the larger black points. The black line is a fit to the binned data. Other correlations from the literature are also plotted. Figure 9 in Garner et al. (2025).
The larger lesson was that a commonly-used diagnostic should not be treated as a black box simply because it has become standard in the literature. Understanding how a calibration was constructed, and whether its assumptions match the observations, is part of making the measurement itself.
Developing a Methodology
This combination of a custom Cloudy grid and Bayesian inference was subsequently adapted within SIGNALS to address very different scientific questions.
In NGC 6946, Bresolin[+Garner] et al. (2025) used this methodology to derive oxygen and nitrogen abundances for hundreds of H II regions and investigate azimuthal abundance structures across the galaxy. We found an azimuthal variation across one of its spiral arms, together with comparable spatial correlation scales for oxygen and nitrogen.
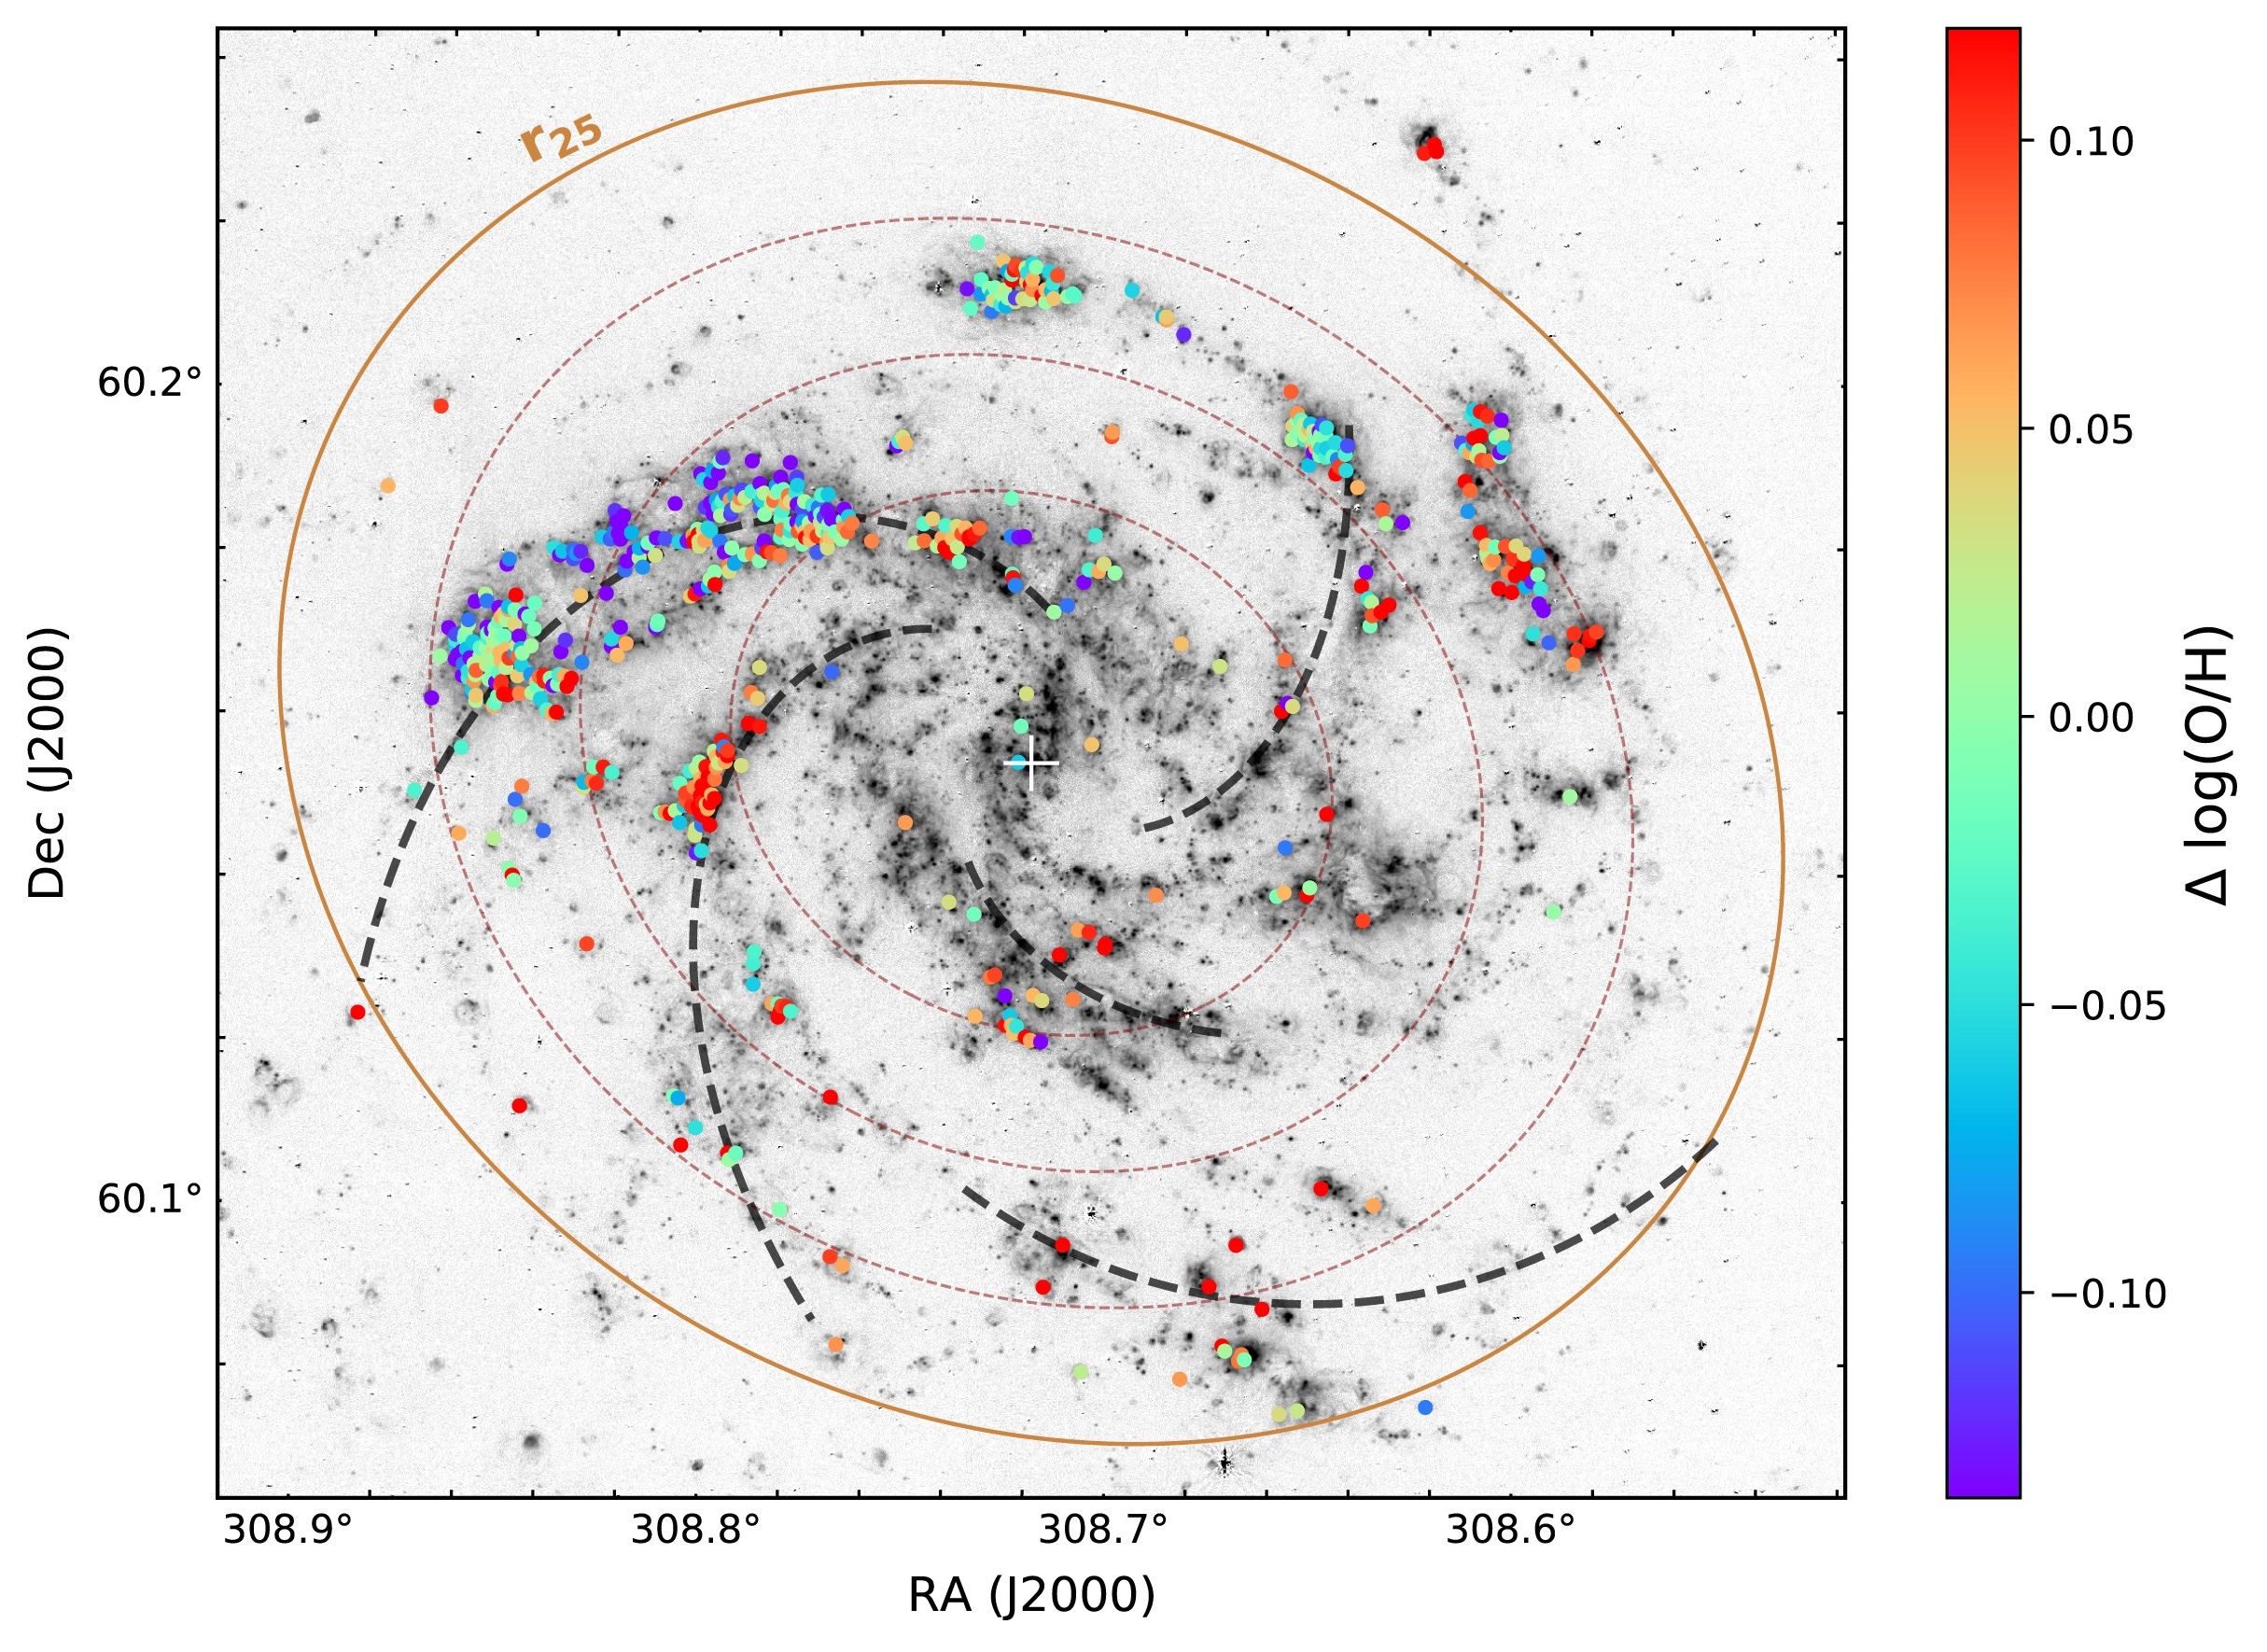
Oxygen abundance variations across the spiral arms of NGC 6946. Along the top left arm, the oxygen abundances grow more metal poor as you move from one side of the arm to the other. Figure 7 in Bresolin et al. (2025).
This methodology has now also been extended again by González-Koda[+Garner] et al. to investigate the N/O-O/H relation for galaxies occupying different parts of the cosmic large-scale structure.
Related Publications
- NGC 628 in SIGNALS: Explaining the Abundance-Ionization Correlation in H II Regions
- SIGNALS on the mixing of oxygen and nitrogen in the spiral galaxy NGC 6946
- The N/O-O/H relation across different large-scale environments
Spatially-Resolved H II Regions
My next lead SIGNALS project approached the same problem from the opposite direction: rather than study thousands of H II regions as individual objects, I asked what happened when we resolve one H II region internally.
NGC 604 in M33 is the most luminous H II region in that galaxy and one of the largest star-forming complexes in the Local Group. At the distance of M33, the SIGNALS observations provide a physical resolution of only a few parsecs. At that scale, the assumptions behind integrated nebular diagnostics can be examined directly.
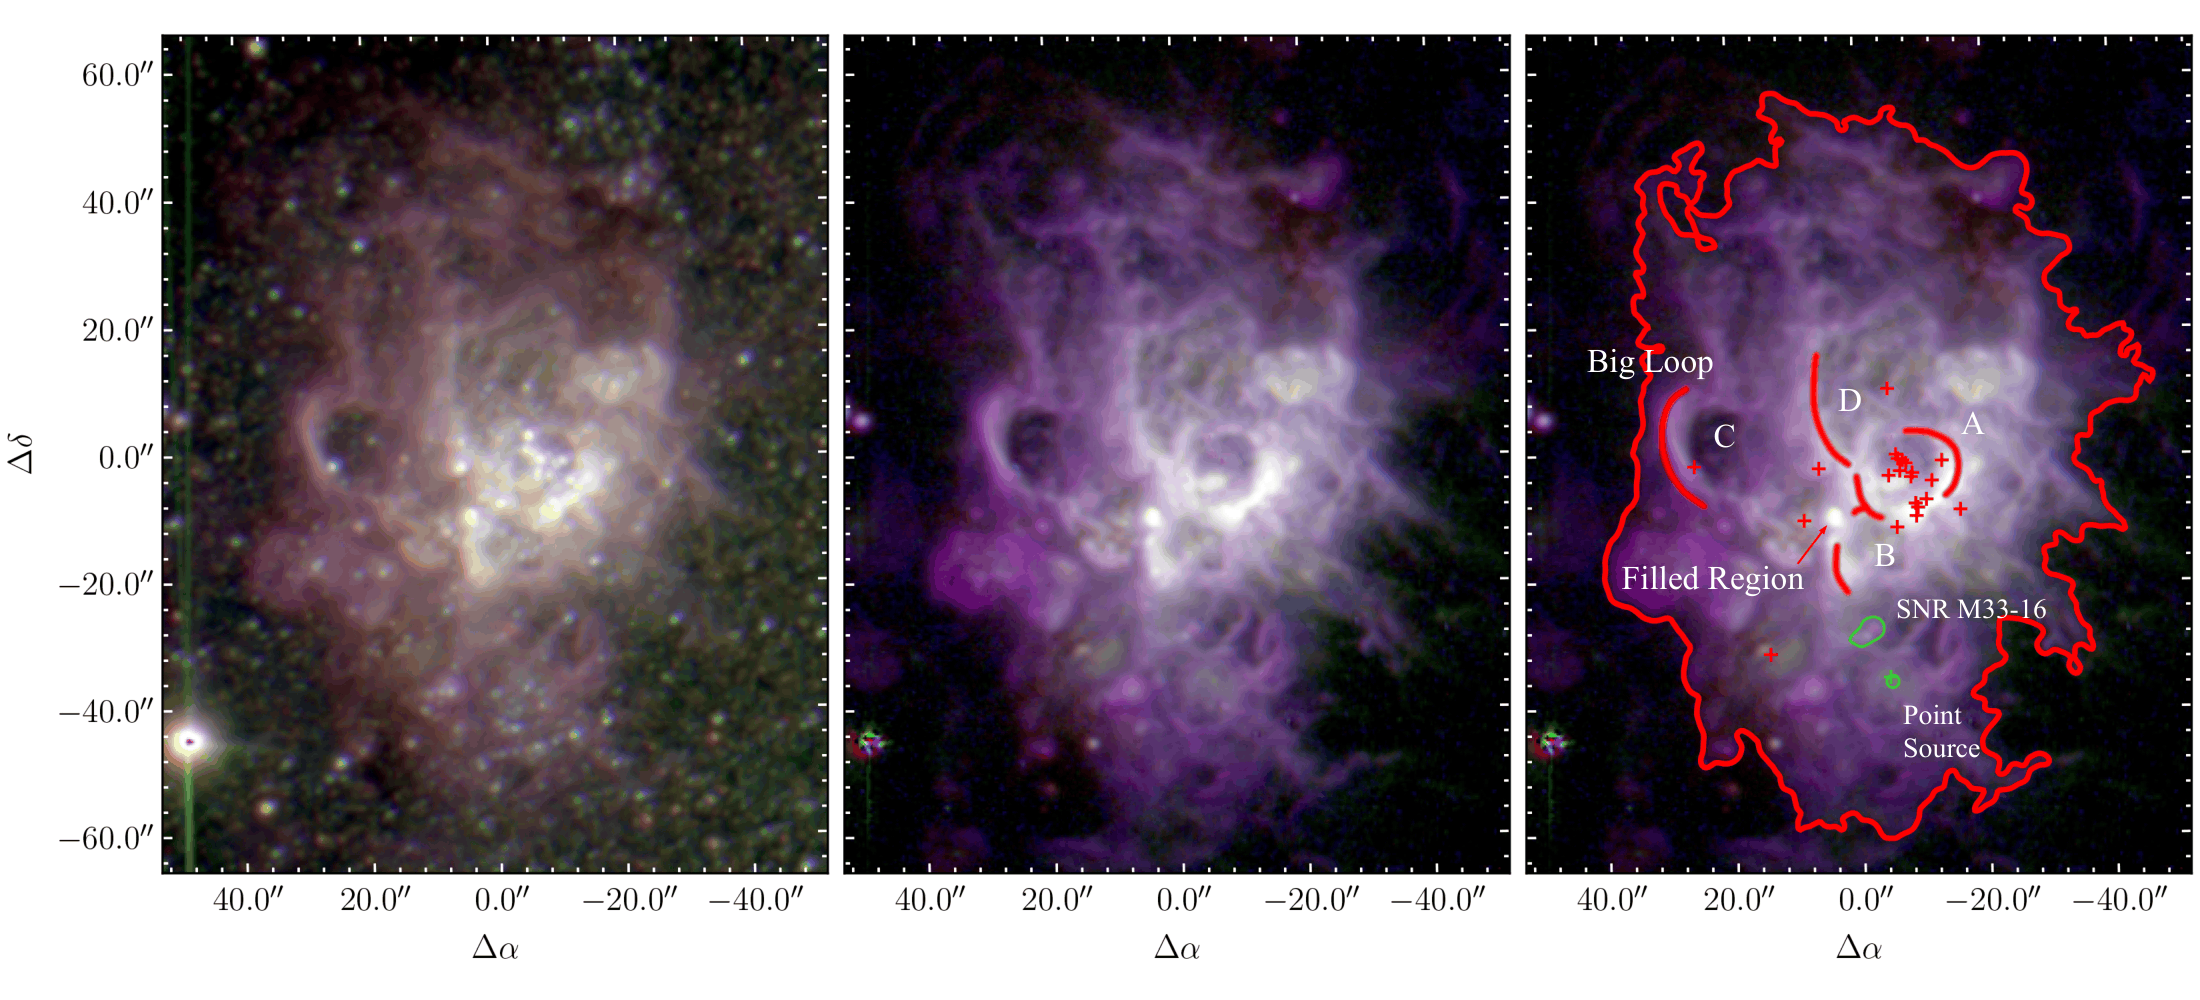
The giant H II region NGC 604 as seen through SITELLE. The left panel shows the deep image formed by summing all three filters together. The middle panel shows an RGB image of the gas emission lines Hα, [O III], and [O II]. The right panel is the same as the middle, but with particular features annotated, including four known bubbles (A-D), and the locations of a supernova remnant and planetary nebula. Figure 1 in Garner et al. (2026).
I mapped the principal optical emission-line rations across the entire nebula and found enormous spatial variations in diagnostics normally used to infer ionization parameter and chemical abundance. Those variations do not primarily trace chemical inhomogeneities. Instead, they closely follow the positions of the massive stellar populations and the shells, cavities, and filaments that those stars have carved into the surrounding gas.
In other words, applying an integrated H II region calibration pixel-by-pixel can return apparently dramatic changes in “metallicity” that are actually changes in ionization structure and geometry.
The resolved data also revealed sources that effectively disappear when the nebula is integrated into one spectrum, including a known supernova remnant and a previously unidentified planetary nebula.
The basic problem is therefore not simply spatial resolution for its own sake. It is understanding what information survives when complex physical structure is compressed into the single spectrum we usually observe.
Related Publications
Stellar Feedback Kinematics
The original SITELLE data were excellent for mapping excitation and ionization, but the Hα profiles showed evidence that multiple kinematic components were unresolved. That immediately suggested a next observation: observe the same nebula at substantially higher spectral resolution.
I led a successful CFHT proposal for new SITELLE SN4 observations at R ∼ 10,000, designed specifically to resolve the ionized gas kinematics of NGC 604.
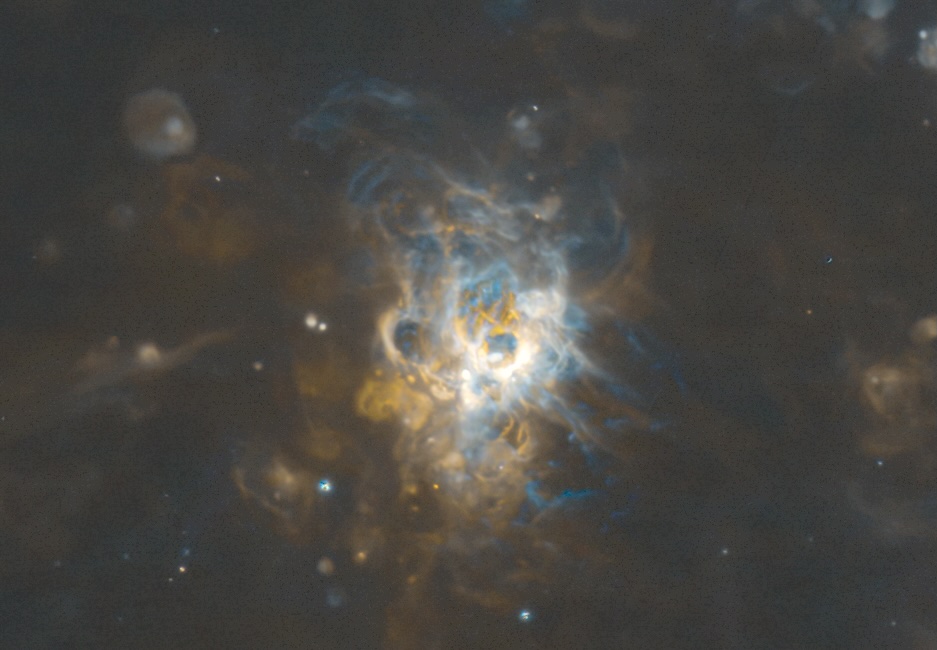
The giant H II region NGC 604 in high-resolution. This is a Doppler image, meaning the blue colors correspond to blueshifted velocities (i.e., gas moving toward us), and the orange colors correspond to redshifted velocities (i.e., gas moving away from us). Courtesy of Laurent Drissen.
The new spectra allow me to fit multiple velocity components across the nebula and construct maps of velocity, velocity dispersion, and kinematic complexity. After removing the large-scale rotation of M33, the residual velocity field contains coherent structures associated with the nebula itself. I am now asking how those gas motions relate to the ionization structure measured in the original SIGNALS observations.
To do this, I have used structure functions, spatial correlation measurements, and cross-comparisons of the resolved maps to quantify characterstic spatial scales. The velocity residuals and velocity dispersion show structure on smaller scales than several ionization-sensitive line ratios, suggesting that the morphology of the radiation field and the motions of the gas do not simply trace one another.
This work has developed into a collaboration with researchers at Aix-Marseille Université, where we can compare NGC 604 with SITELLE observations of Milky Way H II regions at still finer physical resolution. We are attempting to answer the question: What happens to the physics we infer as an H II region moves from sub-parsec resolution to a few parsecs?
Galactic Dynamics
I have also led a successful SITELLE proposal targeting NGC 5474, the peculiar dwarf satellite of M101.
NGC 5474 is scientifically quite different from NGC 604. Instead of resolving one giant H II region, these observations allow me to investigate ionized gas across a galaxy with an unusual dynamical history, asymmetric structure, and an extended low surface brightness disk.
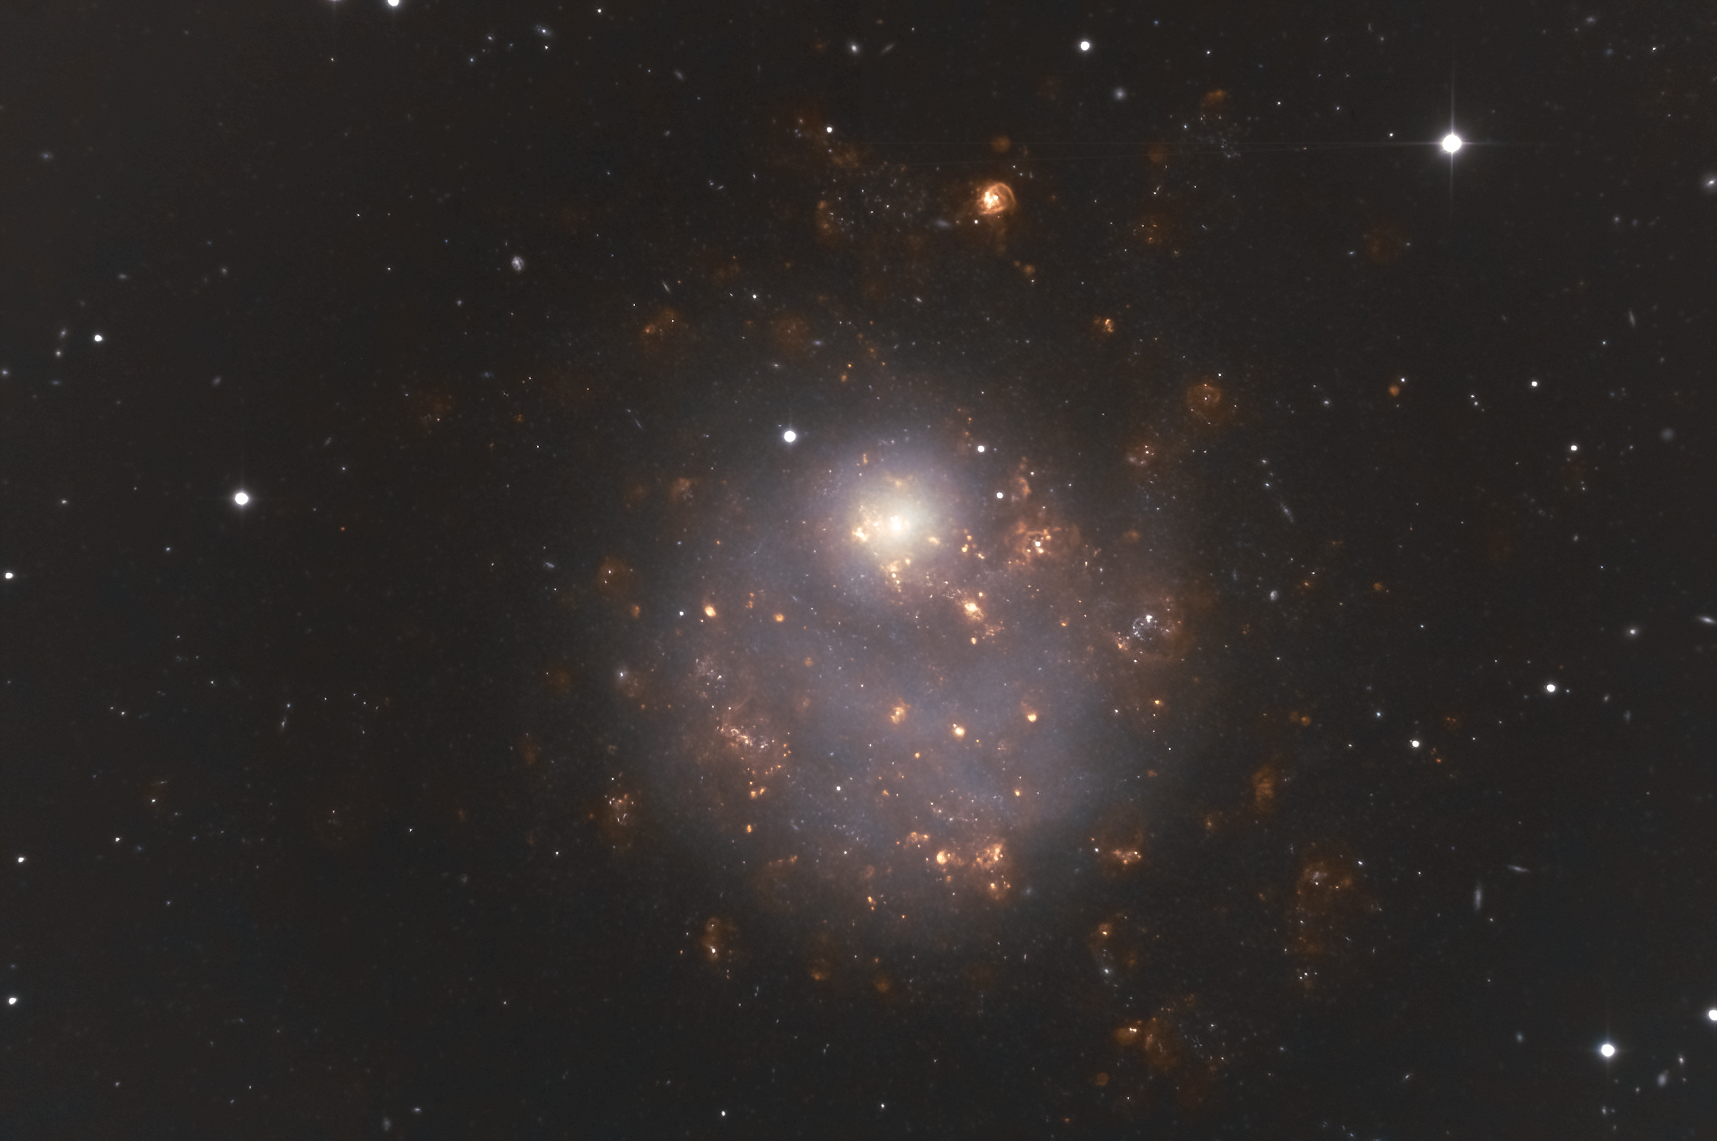
The peculiar dwarf galaxy NGC 5474. Reddish light indicates star-forming regions. Courtesy of Laurent Drissen.
My goal is to use the ionized gas kinematics and H II region population to ask how the gas responded to both the peculiar offset bulge of NGC 5474 and its interaction history with M101. The wide SITELLE field is also particularly valuable for tracing emission into the galaxy’s low surface brightness outskirts.
Science in a Collaboration
SIGNALS has also been important to me because it is my first experience with a large collaborative group.
The survey brings together people studying H II regions, chemical evolution, diffuse ionized gas, stellar feedback, supernova remnants, planetary nebulae, galactic dynamics, and other features we can trace with ionized gas in nearby galaxies. Working within that environment has allowed me to grow as a researcher.
In addition to the NGC 6946 and large-scale environment abundance studies, I am a co-author on SIGNALS work examining AGN-ISM interactions in NGC 4258, where spatially resolved excitation and kinematics reveal how the galaxy’s jet interacts with the surrounding gas.
Several additionall projects are currently moving through the publication process, including:
- a large H II region catalog for M33 (led by Emma Jarvis);
- a comparison of H II region structure using PHANGS-MUSE observations (led by Lorena Aragüete Riesco);
- and work on the filling factor and dust-filament structure of H II regions in NGC 628 (also led by Lorena Aragüete Riesco).
These projects span substantially different science questions, but they share a common need: understanding how resolved nebular structure affects the physical quantities we infer from emission lines.
The Broad Picture
The individual projects above address different objects and different physical questions, but they have increasingly converged on the same underlying theme.
- In NGC 628, I found that even measurements of integrated H II regions depend strongly on the assumptions used to translate emission-line ratios into physical properties.
- In NGC 604, I showed that diagnostics that are meaningful for an integrated nebula can become physically misleading when applied to individual pixels.
- The new NGC 604 observations push this one step further by asking how ionization and gas kinematics are related across physical scales.
- The broader SIGNALS collaboration then provides populations of H II regions across many galactic environments with which those ideas can be tested.
Together, these projects allow me to answer What physical structure produced this line ratio, and what information survives in the way I have observed it?
Methods and Expertise
My work within SIGNALS has developed and demonstrated expertise across several interconnected areas:
Nebular astrophysics H II region physics · chemical abundances · ionization parameter · excitation diagnostics · stellar feedback
Physical modeling Cloudy · NebulaBayes · PyNeb
Spectroscopy CFHT/SITELLE · ORCS · multi-component kinematics
Spatial analysis Resolved emission-line maps · velocity fields · structure functions · correlation lengths
Statistical methods Bayesian inference · Monte Carlo uncertainty propagation
Research development Observing proposal design · collaboration across institutions · mentoring and collaborative analysis
Selected Publications
First Author Work
- Garner et al. (2026): SIGNALS of Giant H II Regions: A Spatially Resolved Analysis of NGC 604
Resolved excitation, ionization, abundance diagnostics, and gas kinematics across one of the Local Group’s most luminous H II regions. - Garner et al. (2025): NGC 628 in SIGNALS: Explaining the Abundance-Ionization Parameter Correlation in H II Regions
A self-consistent photoionization model analysis of more than 1,500 H II regions, testing both the physical O/H-logU relation and the assumptions behind common calibrations.
Collaborative Work
- González-Koda et al. (2026): The N/O-O/H relation across different large-scale environments
N/O-O/H across cluster, filament, and void environments, extending my photoionization methodology to galaxy environments. - Aragüete Riesco et al. (2026): H II Region Filling Factors in NGC 628: Luminosity-Size Relation and Connection with PAH Emission
Investigating the internal gas and dust structure of H II regions. - Fernández-Arenas et al. (2025): Ionized gas in NGC 4258: Exploring the AGN - Star formation connection
SIGNALS study of the spatially resolved excitation and kinematics associated with the galaxy’s anomalous arms and jet-ISM interaction. - Bresolin et al. (2025): SIGNALS on the mixing of oxygen and nitrogen in the spiral galaxy NGC 6946
The Cloudy + NebulaBayes methodology adapted to study azimuthal abundance variations and metal mixing across NGC 6946.
Where This Work Is Going
My long-term goal is to turn the extraordinary spatial information available in nearby H II regions into a better physical foundation for interpreting nebular spectra everywhere else.
High-resolution kinematics can determine how stellar feedback structures the gas and whether the characteristic scales of motion correspond to those seen in ionization diagnostics. Comparisons among Milky Way, Local Group, and more distant H II regions can quantify exactly what information disappears as spatial resolution worsens.
Broader-wavelength spectroscopy can provide a particularly important test. Direct measurements of temperature-sensitive auroral lines across resolved giant H II regions would allow the apparent abundance variations predicted by strong-line diagnostics to be compared against the actual temperature and abundance structure of the gas.
At the same time, the larger SIGNALS sample makes it possible to ask how all of these relationships change with galactic environment: spiral structure, metallicity, star formation rates, interaction history, and location within the host galaxy.
