Extreme Nebular Conditions in the Early Universe with JWST


The first galaxies observed by the James Webb Space Telescope (JWST) do not look like simple younger versions of galaxies in the nearby Universe. Their nebular spectra indicate extremely high ionization, low chemical abundances, dense gas, and very young stellar populations. In some galaxies, the spectra also contain emission that conventional stellar populations can’t produce at all.
These observations create exactly the kind of problem that motivates much of my research: When the physical conditions change dramatically, can we still interpret familiar emission-line diagnostics in the same way?
I have begun exploring that question at Cosmic Dawn as a member of the Carbon-3 Plus Oxygen (C3PO) collaboration1. C3PO uses deep JWST/NIRSpec spectroscopy to measure both the rest-frame ultraviolet and optical spectra of galaxies during the Epoch of Reionization, roughly 6 < z < 9.
This is a powerful combination of lines. The optical spectrum contains familiar diagnostics such as the Balmer lines, [O III], [O II], and the temperature-sensitive [O III] auroral line. The ultraviolet adds transitions from oxygen, silicon, nitrogen, carbon, and helium that probe different ionization zones, densities, abundances, and the shape of the ionizing radiation spectrum. Together, they allow us to investigate the physical properties of these extreme galaxies.
Measuring Properties at Cosmic Dawn
The motivation for C3PO is straightforward: the strongest emission lines already tell us that galaxies near the Epoch of Reionization are unusual, but the weaker lines tell us why.
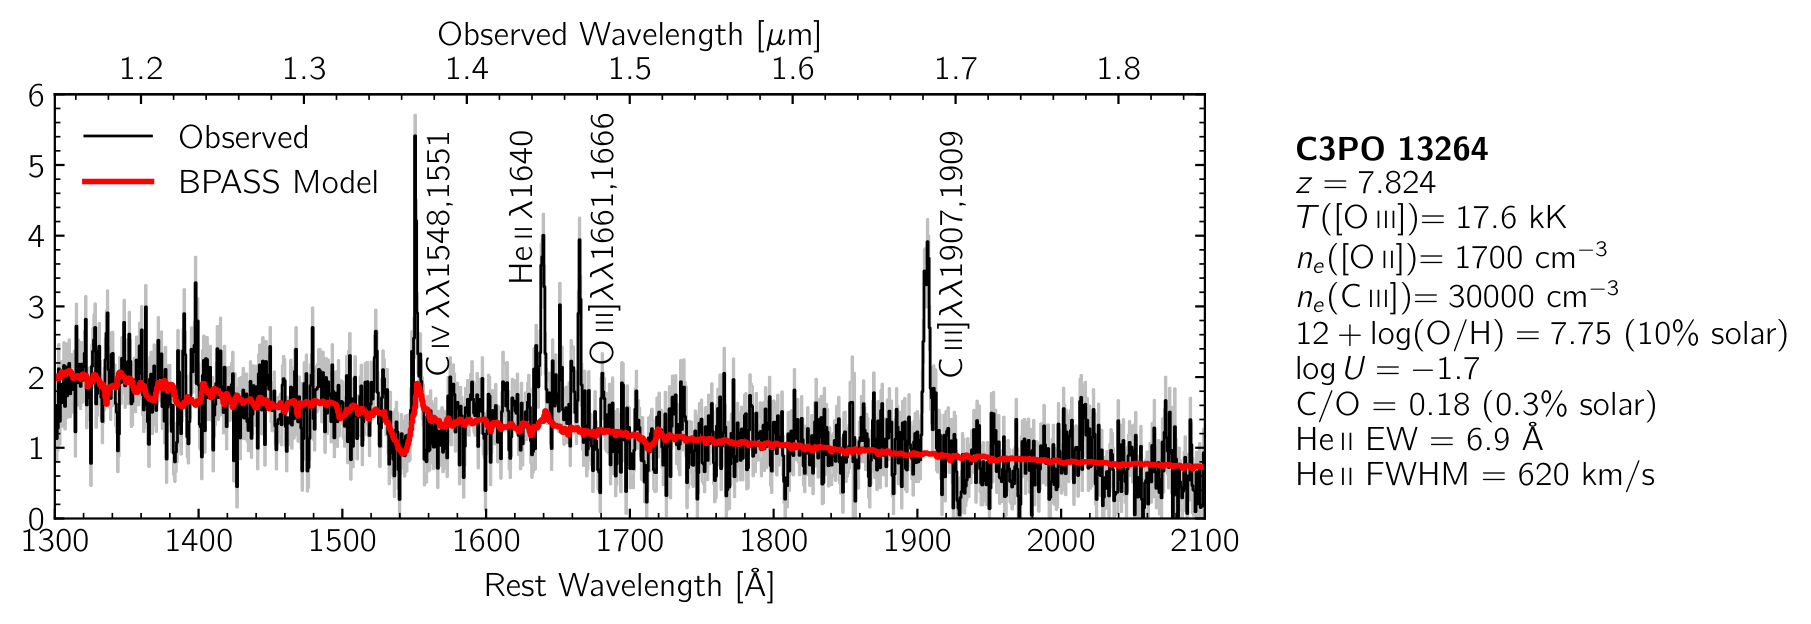
The rest-frame UV spectrum of a redshift ∼ 7 galaxy observed in C3PO. Strong emission lines are marked, including peculiarly strong He II. The red line is a BPASS fit to the underlying stellar continuum.
Deep NIRSpec spectroscopy gives access to a huge set of physical diagnostics. In the optical, the auroral-to-nebular [O III] ratio provides a measurement of the electron temperature, which can be used with other oxygen lines to estimate the gas-phase abundance without relying on strong-line calibrations (which are increasingly uncertain at high redshift!). Density-sensitive doublets probe the structure of the gas. The [O II] doublet traces relatively low-ionization material, while the C III] doublet probes gas at higher ionization.
In the rest-frame UV, C III], O III], C IV, He II, and other lines add constraints on carbon abundance, and thus the C/O ratio, stellar populations, and the hardness of the ionizing radiation responsible for these emission lines.
This is a natural extension of my research in the nearby universe. Locally, I use spatially resolution to test the assumptions behind nebular diagnostics. At high redshift, I cannot resolve individual H II regions, but I can instead use a much richer set of emission lines to constrain the physics directly.
The He II Problem
My primary C3PO project focuses on a subset of galaxies with unusually strong He II λ1640 emission.
Producing He II requires photons energetic enough to ionize He+, above about 54 eV. Standard stellar populations produce relatively few photons at these energies, particularly compared with what is required by several galaxies in the C3PO sample (and others observed by other programs).
Possible explanations include unusual stellar populations, very massive stars, accreting black holes, x-ray binaries, shocks, or combinations of several of these. The challenge is that many different ionizing spectra can be adjusted to reproduce a single He II measurement. Therefore, I am combining measurements from the full NIRSpec spectra with photoionization modeling to address that problem.
The He II line is interesting not only because of its strength, but also because of its kinematics. In the galaxies I am studying, the line widths are not simply identical to either neighboring narrow nebular lines or in the extremely broad stellar-wind features expected from some very-massive star models. That raises the possibility that the highly ionized helium originates in ia physically or dynamically distinct component of the galaxy.
The existing spectra already constrain many of the quantities needed to interpret these sources: electron temperature, electron density, chemical abundance, C/O ratio, and the lower-energy ionizing spectrum. The remaining challenge is determining which physical source produces the photons at the extreme high-energy end.
This project has already motivated me to develop and submit my first JWST observing program, designed as a direct observational follow-up to the questions raised by these C3PO spectra.
Building Models for Galaxies
Interpreting these spectra also requires reconsidering the model grids themselves. A photoionization model can only return physically meaningful answers if the range of conditions explored by the model actually includes the galaxy being observed. That sounds obvious, but JWST is increasingly finding galaxies outside the standard parameter space that was constructed from local Universe systems.
I have been working with graduate student Annabella Yang on her first paper measuring C/O abundance ratios in C3PO galaxies. In particular, these observations motivate extending the models toward low, sub-solar C/O abundance ratios and higher gas densities than are often assumed in standard model grids.
This is important because carbon and oxygen are produced on different stellar timescales and through different pathways. Their ratio therefore constrains information about how rapidly a galaxy has enriched, the populations of stars responsible for that enrichment, and potentially the very short star formation histories of galaxies observed only a few hundred million years after the Big Bang.
When Familiar AGN Diagnostics Stop Working
My beginnings in the high-redshift universe actually began before my current C3PO project. I am a co-author on Cleri et al. (2025), which explored whether familiar optical emission line diagnostics can still distinguish stellar populations from accreting black holes under the physical conditions seen at high redshift.
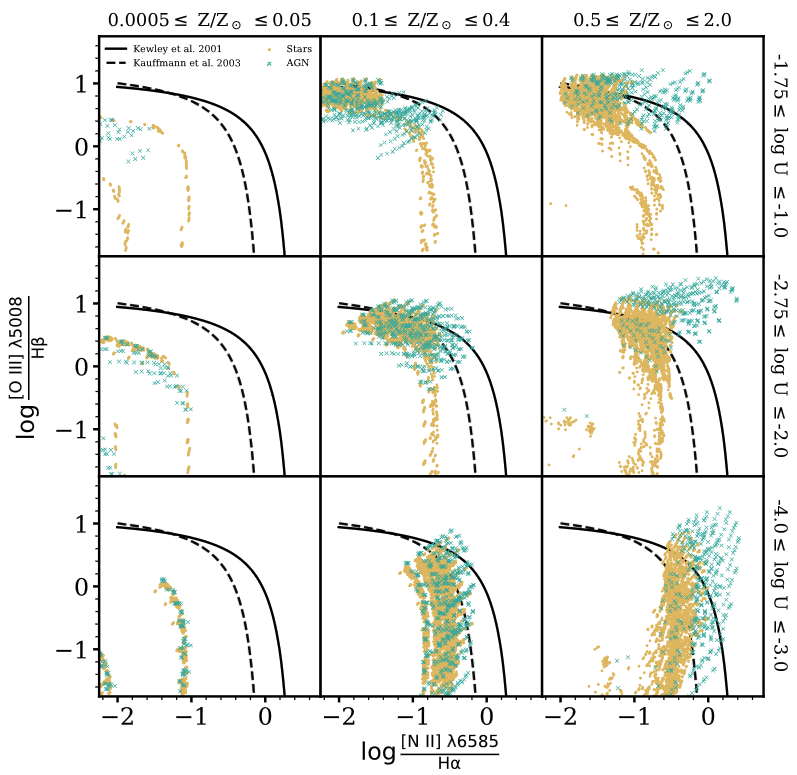
A characteristic optical diagnostic diagram. Models for stellar populations are gold circles, while those for accreting black holes are blue crosses. Each panel shows a particular cross section of metallicity and ionization parameter. At nearly every combination, black holes and stellar populations overlap in the diagnostic space. Figure 8 of Cleri et al. (2025).
Unfortunately, at high ionization parameter and low metallicity, the model predictions for stellar populations and accreting black holes overlap substantially in standard diagnostic diagrams. The line ratios become more sensitive to the gas metallicity and ionization parameter than to the identity of the ionizing source itself.
This means that placing a galaxy on a familiar BPT diagram does not necessarily answer whether stars or black hole accretion dominate the ionizing radiation. Diagnostics based largely on photons below the He+ ionization edge may simply not probe the part of the spectrum where the competeing ionizing sources differ most strongly.
Little Red Dots
I have also contributed to C3PO work led by Casey Papovich studying two Little Red Dots in our sample. These sources truly illustrate how unfamiliar the nebular conditions of early galaxies can be.
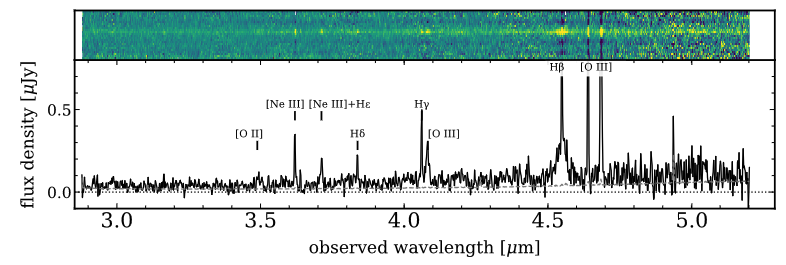
The rest-frame optical spectrum of a galaxy at a redshift of 8.35. Important emission lines are indicated. Note the broad [O III] λ4363 and Hβ emission. Figure 2 from Papovich et al. (2026).
Their spectra contain broad Balmer emission and broad auroral [O III] emission, while several of the stronger forbidden metal lines remain narrow. The inferred densities differ dramatically between these components, suggesting that the emitting gas is strongly stratified rather than described by a single set of physical conditions.
These objects are not the central focus of my own research, but participating in this project broadened my experience with the range of physical conditions present in the C3PO dataset and the high-redshift universe more broadly.
The Broad Picture
At first glance, an H II region a few hundred parsecs across in a nearby spiral galaxy and an unresolved galaxy at the Epoch of Reionization seem like very different research problems.
However, they’re really the same problem at different scales. In nearby galaxies, spatial resolution lets me see that emission line ratios depend on geometry, stellar populations, feedback, and where within an H II region they are measured. At high redshift, those structures are compressed into a single spectrum. At the same time, the physical conditions themselves can be very different from those on which many familiar calibrations were built. The question becomes Which lessons from the nearby Universe remain valid when the nebula is unresolved and the physical regime itself has changed? C3PO gives me the chance to test that directly.
Methods and Expertise
My high-redshift work has expanded my experience across both observational spectroscopy and physical modeling.
JWST spectroscopy NIRSpec spectroscopy · rest-frame UV and optical emission lines · line profile fitting · weak-line measurements
Nebular conditions Electron temperatures · electron densities · direct-method oxygen abundance · multi-zone structure
Ionizing sources Hard ionizing spectra · stellar populations · very massive stars · AGN
Photoionization modeling Cloudy · BPASS · Bayesian model comparison
Research development JWST proposals · mentoring · collaborations
Selected Publications
First Author Work
He II Emitters in C3PO - in preparation:
Analyzing galaxies with strong He II λ1640 emission that can’t be reproduced by standard stellar populations.
Collaborative Work
Yang et al. - in preparation: C/O abundances in Epoch of Reionization galaxies.
Olivier et al. - in preparation: Spatially resolved direct-method abundances in a strongly lensed galaxy.
Papovich et al. (2026): Implications of Broad [O III] λ4364 and UV Line Emission in Two Little Red Dots at z ≈ 7-8
Deep NIRSpec spectroscopy reveals strongly stratified gas conditions and evidence for an additional ionizing source in two compact systems.
Cleri et al. (2025): Optical Strong Line Ratios Cannot Distinguish between Stellar Populations and Accreting Black Holes at High Ionization Parameters and Low Metallicities
Photoionization models demonstrate that familiar rest-optical diagnostics become degenerate under the extreme physical conditions common at high redshift.
Where This Work Is Going
JWST is showing us galaxies with densities, abundance patterns, ionization states, and ionizing spectra that frequently sits at the edges of the models we have traditionally used to interpret nebular emission. Simply extending familiar calibration curves to higher redshift is therefore not enough.
In nearby galaxies, I can resolve the physics. At the Epoch of Reionization, I have only the integrated spectrum, but JWST gives me enough diagnostic lines to interpret that spectrum in unprecedented detail. Together, those regimes let me explore what physical information is encoded in a nebular spectrum, and how do we recover it when the Universe no longer resembles the systems on which our assumptions were built?
As a huge Star Wars fan, it gives me endless happiness that they named the collaboration this way. ↩︎
